The green shift is about sustainable change in a more climate and environmentally friendly direction, and within nature's tolerance limits. The UN believes that loss of nature is as much a threat to humanity as climate change, and the UN's Sustainability Goal # 7 states that everyone shall have access to reliable, sustainable and modern energy at an affordable price. This poses significant challenges when electrifying the world's energy consumption.
A discussion about the energy mix of the future requires an understanding of the total impact each energy source has on health, natural environment, climate and economy. We will all have different views of which aspects that matter the most (e.g. greenhouse gas emissions) and we have therefore created this page so that you can weight the different parameters yourself and see what the outcome will be.
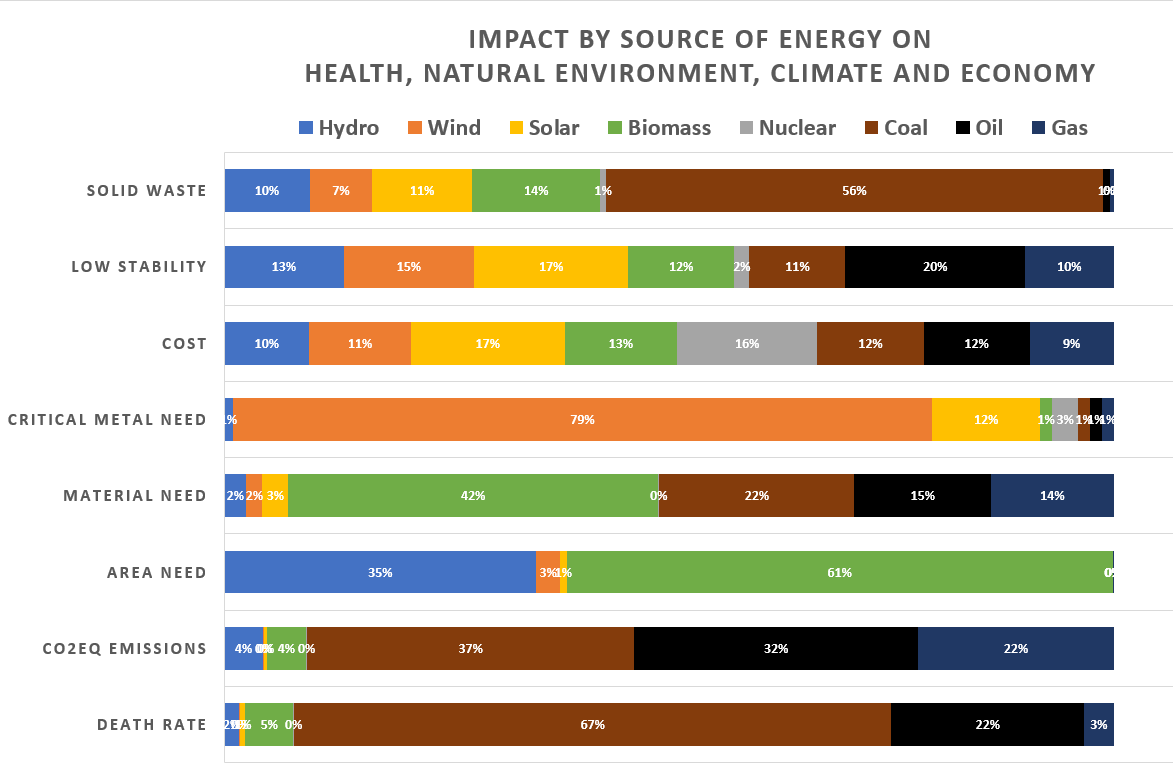
Eight different parameters are included in the analysis. These are mortality, emissions, land use, material use, use of critical metals, costs, stability and waste. The basis for these can be found by clicking on the “Learn more about…”-links. Not all will agree with the choices we have made, but we have tried to be as objective as possible and find the most robust sources. If needed, this can be changed in the future. We hope that this can contribute positively to the debate about the energy mix of the future.
Here you can chose how important each parameter is for you (as a starting point, the parameters are equally weighted), and see which energy type has the lowest footprint in the graph below. Each parameter sums to 100% and the totality is shown in the y-axis.
These are the numbers we have used to calculate the footprint of the energy sources. In some cases, the sources provide ranges. We have then used median- or average values provided by the sources.
UPDATE 10.1.21: Costs for renewables have been updated with 2020 figures from the IEA (for renewables, IEA uses numbers collected by IRENA, but may differ due to different calculations). Note that these figures assume a carbon tax of 30 USD / tonne CO2. Instead of using "Low stability", we have decided to use the term "Not operating" to better reflect that the percentage time that the power plants are not operating due to aspects such as absence of wind or sun, as well as other reasons.
This is simply 100% minus the capacity factor.
The capacity factor has been updated with actual 2019 numbers from Statista, with the exception of fossil fuels and biomass where we have used the IEA's 2020 assumptions of 85% capacity factor.
IEA has chosen to do so because the fuel is always available, allowing the power plants to theoretically operate as needed. Costs for solar and wind power do not reflect system-lcoe (need for backup), which will lead to significantly increased costs with a high share (> 10-20%) in the energy mix. Long-term operation of nuclear power (LTO) has not been taken into account, which will significantly reduce costs. With a 20-year extension of existing nuclear power plants, this type of energy will be the cheapest according to the IEA.
Sources:
Data for this project have been gathered by Jonny Hesthammer and Wouter Bell Gravendeel.
Area calculation
[1] Van Zalk, John, og Paul Behrens.
“The Spatial Extent of Renewable and Non-Renewable Power Generation: A Review and Meta-Analysis of Power Densities and Their Application in the U.S.” Energy Policy, vol. 123, Dec. 2018, pages. 85–88. DOI.org (Crossref), doi:10.1016/j.enpol.2018.08.023.
Cost
[2] Renewable Energy Costs in 2018. IRENA, 2019. [Online]. Available:
https://www.irena.org/-/media/Files/IRENA/Agency/Publication/2019/May/IRENA_Renewable-Power-Generations-Costs-in-2018.pdf. [Accessed: 24. March 2020]
[3] Stacy, Thomas F., og George S. Taylor. The Levelized Cost of Electricity from Existing Generation Resources. Institute for Energy Research, June 2019. [Online]. Available:
https://www.instituteforenergyresearch.org/wp-content/uploads/2019/06/IER_LCOE2019Final-.pdf. [Accessed: 24. March 2020]
[4] “New Energy Outlook 2019.” Bnef.Com, BloombergNEF, 2019. [Online]. Available:
https://bnef.turtl.co/story/neo2019/. [Accessed: 26. March 2020]
[35] International Energy Agency, «Projected Costs of Generating Electricity », IEA, France, 2020 [Online]. Available:
https://www.iea.org/reports/projected-costs-of-generating-electricity-2020. [Accessed: January 10, 2021]
[36] M. Taylor, Pablo Ralon, H. Anuta, og S. Al-Zoghoul, «Renewable Power Generation Costs in 2019», IRENA, ISBN 978-92-9260-244-4, 2020 [Online]. Available:
https://www.irena.org/-/media/Files/IRENA/Agency/Publication/2020/Jun/IRENA_Power_Generation_Costs_2019.pdf. [Accessed: January 10, 2021]
Emission
[5] R. Turconi, A. Boldrin, og T. Astrup,
“Life cycle assessment (Lca) of electricity generation technologies: Overview, comparability and limitations,” Renewable and Sustainable Energy Reviews, vol. 28, pp. 555–565, Dec. 2013, doi: 10.1016/j.rser.2013.08.013.
[6] M. Pehl, A. Arvesen, F. Humpenöder, A. Popp, E. G. Hertwich, og G. Luderer,
“Understanding future emissions from low-carbon power systems by integration of life-cycle assessment and integrated energy modelling,” Nature Energy, vol. 2, no. 12, pp. 939–945, Dec. 2017, doi:10.1038/s41560-017-0032-9.
Supplementary tables download link:
https://static-content.springer.com/esm/art%3A10.1038%2Fs41560-017-0032-9/MediaObjects/41560_2017_32_MOESM2_ESM.xls
[7] R. K. Pachauri, L. Mayer, og Intergovernmental Panel on Climate Change, Eds., Climate change 2014: synthesis report. Geneva, Switzerland: Intergovernmental Panel on Climate Change, 2015. [Online]. Available:
https://www.ipcc.ch/siteassets/uploads/2018/02/ipcc_wg3_ar5_annex-iii.pdf. [Accessed: 17. March 2020]
Mortality
[8] A. Markandya, og P. Wilkinson,
“Electricity generation and health,” The Lancet, vol. 370, no. 9591, pp. 979–990, Sep. 2007, doi: 10.1016/S0140-6736(07)61253-7.
[9] B. K. Sovacool et al.,
“Balancing safety with sustainability: assessing the risk of accidents for modern low-carbon energy systems,” Journal of Cleaner Production, vol. 112, pp. 3952–3965, Jan. 2016, doi: 10.1016/j.jclepro.2015.07.059.
[10] H. Ritchie, “What are the safest sources of energy?,” Our World in Data, 2020. [Online]. Available:
https://ourworldindata.org/safest-sources-of-energy. [Accessed: 17. March 2020]
[11] J. Conca, “How deadly is your kilowatt? We rank the killer energy sources,” Forbes. [Online]. Available:
https://www.forbes.com/sites/jamesconca/2012/06/10/energys-deathprint-a-price-always-paid/. [Accessed: 17. March 2020]
Material use
[12] “Quadrennial Technology Review 2015.” Energy.Gov, U.S. Department of Energy, Sept. 2015, [Online]. Available:
https://www.energy.gov/sites/prod/files/2017/03/f34/quadrennial-technology-review-2015_1.pdf. [Accessed: 23. March 2020]
[13] “Fuel Consumption of Conventional Reactor.” Nuclear Power, Nuclear Power, unknown. [Online]. Available:
https://www.nuclear-power.net/nuclear-power-plant/nuclear-fuel/fuel-consumption-of-conventional-reactor/. [Accessed: 23. March 2020]
[14] Wang, T. “Capacity Factors for Selected Energy Sources U.S. 2018.” Statista, 21 Oct. 2019. [Online]. Available:
https://www.statista.com/statistics/183680/us-average-capacity-factors-by-selected-energy-source-since-1998/ [Accessed: 23. March 2020]
[15] Benzo Energy, “What is the weight of lithium-ion battery per kWh? - Benzo Energy / China best polymer Lithium-ion battery manufacturer,lithium ion battery,lipo battery pack,LiFePO4 battery pack, 18650 batteries, Rc battery pack,” 21-Oct-2019. [Online]. Available:
http://www.benzoenergy.com/blog/post/what-is-the-weight-of-lithium-ion-battery-per-kwh.html. [Accessed: 26. March 2020]
Critical metals
[16] Publications Office of the European Union. Critical Metals in the Path towards the Decarbonisation of the EU Energy Sector: Assessing Rare Metals as Supply-Chain Bottlenecks in Low-Carbon Energy Technologies. 10 Oct. 2014. [Online]. Available:
http://op.europa.eu/en/publication-detail/-/publication/505c089c-7655-4546-bd17-83f91d581190/language-en/format-PDF. [Accessed: 23. March 2020]
[17] European Commission. “Critical Raw Materials.” Internal Market, Industry, Entrepreneurship and SMEs - European Commission, European Commission, 5 July 2016. [Online]. Available:
https://ec.europa.eu/growth/sectors/raw-materials/specific-interest/critical_en. [Accessed: 23. March 2020]
Waste
[12] “Quadrennial Technology Review 2015.” Energy.Gov, U.S. Department of Energy, Sept. 2015, [Online]. Available:
https://www.energy.gov/sites/prod/files/2017/03/f34/quadrennial-technology-review-2015_1.pdf. [Accessed: 23. March 2020]
[18] “5 Fast Facts about Spent Nuclear Fuel,” Energy.gov, 30-Mar-2020. [Online]. Available:
https://www.energy.gov/ne/articles/5-fast-facts-about-spent-nuclear-fuel [Accessed: 25-May-2020]
[19] F. Lamers, M. Cremers, D. Matschegg, and C. Schmidl, “Options for increased use of ash from biomass combustion and co-firing,” 2018 [Online]. Available:
https://www.ieabioenergy.com/wp-content/uploads/2019/02/IEA-Bioenergy-Ash-management-report-revision-5-november.pdf [Accessed: 25-May-2020]
[20] T. H. Adams, “Coal Ash Recycling Rate Declines Amid Shifting Production and Use Patterns,” American Coal Ash Association, Washington, D.C., Nov. 2019 [Online]. Available:
https://www.acaa-usa.org/Portals/9/Files/PDFs/Coal-Ash-Production-and-Use.pdf [Accessed: 25-May-2020]
[15] Benzo Energy, “What is the weight of lithium-ion battery per kWh? - Benzo Energy / China best polymer Lithium-ion battery manufacturer,lithium ion battery,lipo battery pack,LiFePO4 battery pack, 18650 batteries, Rc battery pack,” 21-Oct-2019. [Online]. Available:
http://www.benzoenergy.com/blog/post/what-is-the-weight-of-lithium-ion-battery-per-kwh.html. [Accessed: 26. March 2020]
Stability
[21] Wang, T. “Capacity Factors for Selected Energy Sources U.S. 2018.” Statista, 21 Oct. 2019. [Online]. Available:
https://www.statista.com/statistics/183680/us-average-capacity-factors-by-selected-energy-source-since-1998/ [Accessed: 23. March 2020]
[34] N. Sönnichsen, “Capacity factors for selected energy sources U.S. 2019”, Statista, July 27, 2020. [Online]. Available:
https://www.statista.com/statistics/183680/us-average-capacity-factors-by-selected-energy-source-since-1998/. [Accessed: January 10, 2021]
[35] International Energy Agency, «Projected Costs of Generating Electricity », IEA, France, 2020 [Online]. Available:
https://www.iea.org/reports/projected-costs-of-generating-electricity-2020 . [Accessed: January 10, 2021]
Current energy use by source
[22] B. Dudley, “Statistical review of world energy,” BP global, 2019. [Online]. Available:
https://www.bp.com/en/global/corporate/energy-economics/statistical-review-of-world-energy.html. [Accessed: 17. March 2020]
[23] V. Smil, Energy and civilization: a history. Cambridge, Massachusetts: The MIT Press, 2017. [Online]. Available:
http://vaclavsmil.com/2016/12/14/energy-transitions-global-and-national-perspectives-second-expanded-and-updated-edition/. [Accessed: 17. March 2020]
[10] H. Ritchie, “What are the safest sources of energy?,” Our World in Data, 2020. [Online]. Available:
https://ourworldindata.org/safest-sources-of-energy. [Accessed: 17. March 2020]
CCS
[24] B. Metz, O. Davidson, M. Leo, L. Manuela, and H. de Coninck, “Carbon Dioxide Capture and Storage,” Intergovernmental Panel on Climate Change, New York, 2005 [Online]. Available:
https://www.ipcc.ch/siteassets/uploads/2018/03/srccs_wholereport-1.pdf [Accessed: June 22, 2020]
[25] S. Budinis, S. Krevor, N. M. Dowell, N. Brandon, and A. Hawkes,
“An assessment of CCS costs, barriers and potential,” Energy Strategy Reviews, vol. 22, pp. 68, table 6, Nov. 2018, doi: 10.1016/j.esr.2018.08.003.
Energy mix 2050 (IPPC median values)
[26] J. Rogelj, D. Shindell, and K. Jiang, “Mitigation Pathways Compatible with 1.5°C in the Context of Sustainable Development,” IPCC, 2019, page 132-133 [Online]. Available:
https://www.ipcc.ch/siteassets/uploads/sites/2/2019/02/SR15_Chapter2_Low_Res.pdf [Accessed: May 6, 2020]
Energy use and area need per capita
[27] D. Mackay, Sustainable Energy - Without the hot air. Cambridge: UIT, 2009 [Online]. Available:
https://www.withouthotair.com/[Accessed: June 22, 2020]
[28] “Energy use (kg of oil equivalent per capita) | Data.” [Online]. Available:
https://data.worldbank.org/indicator/EG.USE.PCAP.KG.OE?view=map[Accessed: June 22, 2020]
[29] “List of countries and dependencies by area,” Wikipedia. 10-Jun-2020 [Online]. Available:
https://en.wikipedia.org/w/index.php?title=List_of_countries_and_dependencies_by_area&oldid=961823799[Accessed: June 22, 2020]
[1] Van Zalk, John, og Paul Behrens.
“The Spatial Extent of Renewable and Non-Renewable Power Generation: A Review and Meta-Analysis of Power Densities and Their Application in the U.S.” Energy Policy, vol. 123, Dec. 2018, pages. 85–88. DOI.org (Crossref), doi:10.1016/j.enpol.2018.08.023.
Conversions
[30] Tons Of Coal Equivalent to Tons Of Oil Equivalent | Kyle’s Converter. [Online]. Available:
http://www.kylesconverter.com/energy,-work,-and-heat/tons-of-coal-equivalent-to-tons-of-oil-equivalent. [Accessed: 23. March 2020]
[31] Cubic Feet Of Natural Gas to Tons Of Oil Equivalent | Kyle’s Converter. [Online]. Available:
http://www.kylesconverter.com/energy,-work,-and-heat/cubic-feet-of-natural-gas-to-tons-of-oil-equivalent. [Accessed: 23. March 2020]
[32]“Cubic Feet to Cubic Meters Conversion.” Metric Conversions, Wight Hat Ltd.. [Online]. Available:
https://www.metric-conversions.org/volume/cubic-feet-to-cubic-meters.htm. [Accessed: 23. March 2020]
[33] Hofstrand, Don. Biomass Measurements and Conversions | Ag Decision Maker. Iowa State University, Oct. 2008. [Online]. Available:
https://www.extension.iastate.edu/agdm/wholefarm/html/c6-88.html. [Accessed: 23. March 2020]